Dental management control: an operational guide for owners
Management control in the dental practice transforms revenue and costs into profit: indicators, dashboard, and steps to start next month.

Dental management control: an operational guide for practice owners
Dental management control is the system that transforms turnover, costs, and clinical data into actual profit, not just numbers to be handed over to the accountant. Applied consistently, it allows you to identify which treatments are truly profitable and which ones are eroding margins. In the following paragraphs, you will see the KPIs to monitor, how to build a concise dashboard, and the practical steps to start as early as next month.
In brief:
Effective management requires a monthly or quarterly cycle of collection, analysis, and corrective actions on key KPIs such as margins, saturation, and DSO.
It is crucial to activate voice automation systems, automatic reminders, and integrated management to optimize the quality and timeliness of data.
Constantly monitor fixed and variable costs, paying close attention to procedures, to identify non-profitable dental branches and improve margins.
The front office and associates must be involved and trained to ensure the reliability of the data entered into the control system.
An integrated, regularly updated management control system allows you to scale the dental practice with confidence without losing sight of clinical quality and financial margins.
TreatbaseMore control, less bureaucracyTreatbase integrates invoices, procedures, and automatic reminders to help the dental practice better manage data and daily activities.Discover Treatbase
Table of Contents
What management control is in a dental practice and why it is needed
The three operational phases to implement
Essential KPIs to monitor and how to interpret them
Practical tools: management software, dashboards, and summary reports
Step-by-step practical implementation
Practical example: how automation reduces administrative work
How to calculate the profitability of treatment plans
Scheduling, no-shows, and recalls: operational levers on profitability
Budgeting and financial forecasting for the dental practice
Fixed and variable costs: where the margin is hidden
Staff management and optimization of related costs
Risk assessment and external economic variables
Tax regulations and linked accounting obligations
Management control and clinical quality: a direct link
Perspective: the role of the practice owner in making the numbers work
How Treatbase simplifies daily management control
Sources
Frequently Asked Questions
What management control is in a dental practice and why it is needed
Tax accounting tells you how much you billed and how much tax you have to pay. Management control tells you if you are actually making a profit, procedure by procedure, chair by chair. They are two different tools that answer different questions: one looks to the past to fulfill regulatory obligations, the other looks at the present and future to guide decisions.
A practice can have high billing and modest margins if fixed costs are out of control or if part of the price list is operating below cost. This is where dental management control becomes decisive: it transforms data on billing, fixed and variable costs, and cash flow into operational decisions instead of letting them sit in an Excel file updated once a year.
The concrete goals of this system are threefold:
Liquidity: knowing at any moment how much cash is available and how much is locked up in unpaid invoices.
Margins: understanding which treatments, which associates, and which time slots generate actual profit.
Scalability: building processes that allow you to open a second chair or a second location without losing control over the numbers.
Who reads these reports? Not just the owner. The clinical manager, when present, should have access to the same data to intervene operationally on the front office, the schedule, and relations with associates. After all, management control is not a subject reserved for accountants: whoever leads the practice must know how to read the numbers and turn them into actions, otherwise the system remains an academic exercise.
The three operational phases to implement
A dental management control system works only if it follows a repeatable cycle. It is not enough to collect data once: you need a process that is renewed every month or every quarter.
Data collection. Record billing per procedure, fixed costs (rent, staff, utilities), variable costs (materials, dental laboratory), number of first visits, accepted treatment plans, and average collection times. Each item must be coded consistently in the software, otherwise comparing one month with another becomes impossible.
Analysis and reporting. Raw data must be summarized into a report readable in a few minutes, not a thirty-page archive. A one- or two-page dashboard showing deviations from the previous month and the budget is the most effective tool for an owner who has five minutes between patients.
Corrective action. Any significant deviation (a drop in treatment plan acceptance rates, an increase in no-shows, a falling margin on a procedure) must trigger a decision within days, not next quarter.
A tip: do not wait for the year-end financial statements to realize that a clinical branch is operating at a loss. A dashboard updated every month takes less time than you think and avoids bitter surprises in December.
The weak point of many practices is not the lack of data, but the excess of useless data. Five indicators followed consistently are better than twenty numbers looked at once and then abandoned.
KPIs to monitor and how to interpret them
Not all numbers deserve the same attention. Some indicators truly tell the economic health of the practice, while others are background noise.
Hourly profitability per chair: billing generated divided by actual opening hours of the chair. Below a certain threshold (which varies by area and specialization), the chair is operating at a loss relative to the fixed costs it generates.
Chair saturation: percentage of available hours actually occupied by appointments. Saturation below 70% indicates room for improvement in scheduling.
Treatment plan acceptance rate: how many proposed treatment plans are accepted. A sudden drop signals issues in clinical communication or perceived pricing.
DSO (Days Sales Outstanding): how much time passes between the procedure being performed and the payment being collected. High values lock up liquidity that could be reinvested.
Impact of associate costs and dental laboratory costs: percentage of billing absorbed by these items, often underestimated relative to their real impact on margins.
These five indicators, together, form the minimum core of a functioning dental management control system, and each requires a warning threshold customized to the specific practice.
It is a signal that requires immediate analysis of the communication process with the patient, before the drop translates into a revenue hole in the following quarter.
Practical tools: management software, dashboards, and summary reports
The software you choose determines how much manual work will be needed to extract the data required for management control. The features to look for are not decorative; they are operational.
Multi-chair schedule: simultaneous visibility of all chairs, to calculate real rather than estimated saturation.
Complete patient records: visit history, treatment plans, payment status all in one place.
Integrated billing: automatic issuance that reduces manual errors and waiting times.
Automatic reminders: reduce no-shows, which are one of the most underestimated sources of loss in the practice.
The main dashboard should open with the five KPIs described above, not with a list of transactions. The owner must see the deviations on the first page, not the details: those remain a level below, accessible only if a deeper dive is needed.
A tip: avoid creating two parallel systems, one for accounting and one for management control. Integrating the data already present in the clinical software into a single view is the most sustainable path: creating useless reports that burden the front office is the most common risk when introducing a new monitoring system.
Financial management integrated into the software allows you to connect clinical data directly to financial data, without manual transfers between different spreadsheets.
Step-by-step practical implementation
Activating management control does not require a six-month project. It requires order and a clear starting point.
Initial audit. Collect data from the past 12 months: billing per procedure, fixed costs, variable costs, number of proposed and accepted treatment plans. The deliverable is a starting dataset on which to build the first monthly comparisons.
Setup of KPIs in the software. Code each procedure so that the system can automatically calculate profitability and saturation. This step requires involving the front office staff who enter appointments, because data quality depends on those who record it daily.
Definition of warning thresholds. For each KPI, establish the value below (or above) which action is needed. Without thresholds, numbers remain passive observations.
First monthly report. Generate the first dashboard and compare it with the previous period. Do not expect perfection on the first try: the value emerges from repeated comparison over time.
Decision cycle. Set a fixed time, every month or every quarter, to review the report with whoever has operational responsibility and decide on corrective actions before they become emergencies.
The most effective operational actions include schedule optimization, clear definition of front office roles, and periodic recalculation of the hourly chair cost: three levers that alone explain most of the difference between a practice that bills well and one that profits well.
Practical example: how automation reduces administrative work
The most fragile part of management control is not analysis; it is data collection. If the front office has to manually transcribe every visit, the risk of errors and delays grows, and reports always arrive too late for the decisions they should guide.
Some dental software programs address this problem with voice artificial intelligence, allowing the clinical chart to be filled out by speaking during the visit, without stopping to write. These systems can also handle billing, automatic patient reminders, and procedure monitoring, reducing the manual steps that normally slow down the collection of data needed for management control.
Practices that adopt this type of automation can save significant hours of administrative work per month—time that translates directly into more space for patient care and cleaner data for those analyzing the practice's numbers.
Some concrete elements that simplify integration with management control:
Voice entry of clinical charts, without subsequent manual transcription.
Automated invoicing and payment management, with fewer typing errors.
Automatic reminders that reduce no-shows without manual intervention from the front office.
Free data migration from the previous management software, with no operational downtime.
Anyone considering changing software should check how much time is actually freed up at the front desk and how much the margin of error in invoicing is reduced—the two factors that weigh most on the quality of data fueling management control.
How to calculate the profitability of treatment plans
Every treatment plan has an hourly chair cost that is often ignored when setting prices. The calculation starts with the monthly fixed costs of the practice (rent, front office staff, utilities, depreciation) divided by the actual opening hours of the chairs. The result is the minimum cost that each chair hour must generate just to break even on fixed expenses, before even considering materials and margin.
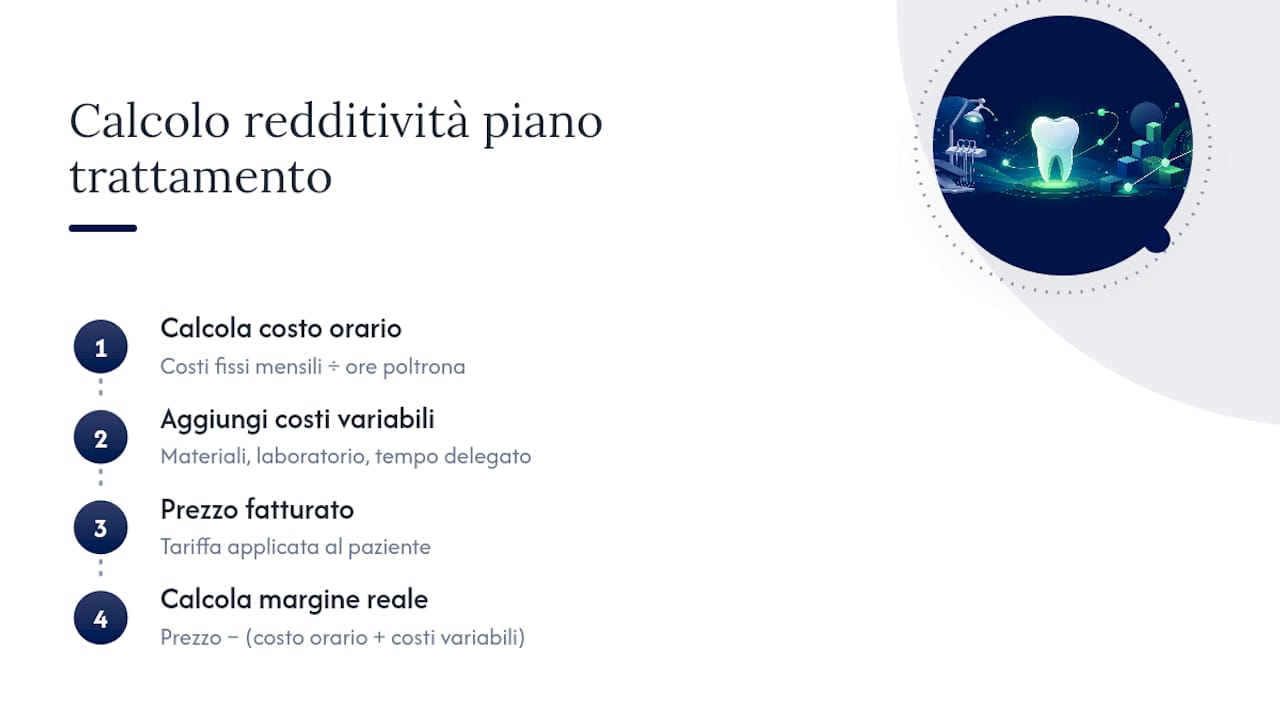
To this are added the variable costs specific to the treatment: materials, any dental laboratory fees, and the associate's time if the treatment is delegated. Only by subtracting both items from the billed price does the actual margin emerge.
Calculating the hourly cost per chair and the margin for each individual procedure is the most effective action to discover which clinical branches are not profitable, even when they generate significant apparent billing. A complex implant treatment can have a lower margin than a hygiene cycle if laboratory costs and chair time absorbed are not properly considered.
The module dedicated to associates and procedures allows you to code each item with the detail required for this type of calculation, without having to manually cross-reference different sheets at the end of each month.
Billing a lot does not automatically equate to earning more: the true break-even point must be periodically recalculated on real fixed costs, not estimated once at the beginning of the year and left unchanged.
Scheduling, no-shows, and recalls: operational levers on profitability
Scheduling is probably the most underestimated lever in management control. An empty chair for an hour does not just represent lost revenue, but also a fixed cost that continues to run with no production to offset it.
No-shows are the primary cause of unplanned schedule gaps. Automatic reminders via WhatsApp have a read rate of over 90%, much higher than SMS or email, and significantly reduce uncommunicated absences. A practice that switches from manual (or absent) reminders to automatic reminders often sees an immediate and measurable drop in no-shows as early as the first month.
Recalls, meaning the periodic recall of patients for check-ups and hygiene, are the second lever. This is not just a clinical preventive activity; it is a source of recurring and predictable revenue that reduces the practice's dependence on new patient acquisition, a channel that is becoming increasingly expensive.
A well-structured multi-chair schedule allows you to see in real-time where recurring gaps occur—for example, Tuesday afternoons or Fridays after 5:00 PM—and intervene with targeted recall campaigns for those specific time slots.

Managing the clinical diary and reminders for individual patients also helps stabilize revenue: a patient with an active and well-tracked recall plan generates recurring billing without requiring new marketing actions.
Budgeting and financial forecasting for the dental practice
A dental practice's budget should not be a generic figure projected from the previous year. It should be built by clinical branch, cross-referencing chair saturation, patient seasonality, and average collection times.
A realistic budget starts with historical data from the past 12 months, segmented by month, to identify the practice's own seasonality: many practices see a natural decline in August and a peak in September and January, when patients return to book appointments after the summer and Christmas breaks.
The financial forecast must separate expected revenue from expected cash, because the two values almost never coincide. A treatment plan billed today may generate actual cash only weeks or months later, especially if the practice offers installment payment plans. Monitoring DSO alongside the forecast budget avoids planning investments (a new chair, a new associate) on liquidity that is not actually available yet.
A quarterly budget, reviewed every three months in light of actual data, works better than a rigid annual budget: it allows for rapid corrections without chasing deviations accumulated over eleven months before noticing them.
Fixed and variable costs: where the margin is hidden
The fixed costs of a dental practice (rent, administrative staff, utilities, management software, equipment depreciation) remain stable regardless of the number of patients treated. They are the basis for calculating the hourly chair cost described above, and must be monitored especially in relation to saturation: if fixed costs grow but saturation remains flat, the margin shrinks without the owner immediately noticing.
Variable costs (materials, dental laboratory, any percentage fees for associates), on the other hand, change in proportion to the volume of activity. Here, management control serves to verify that the price list actually covers these costs with an adequate margin, procedure by procedure.
A common mistake is to analyze costs only in aggregate at the end of the year. Separating fixed and variable costs month by month allows you to immediately understand if an increase in dental laboratory costs needs to be offset by a fee guide adjustment or a supplier change, before the effect accumulates over twelve months of billing.
Staff management and optimization of related costs
Staff is often the second largest fixed cost item after rent, and the least analyzed in terms of actual productivity. A clear organizational chart, with defined roles and responsibilities for each staff member, reduces inefficiencies arising from overlapping or unassigned tasks.
For clinical associates paid on percentage, management control must verify that the impact of their compensation on the revenue generated remains consistent with the overall profitability of the procedure. An hygienist or associate dentist who is highly productive in terms of revenue can still generate a low margin if the agreed percentage does not account for the fixed costs absorbed by their activity.
Training the front office staff on the correct use of the software has a direct impact on the quality of data collected, and therefore on the reliability of the entire downstream management control. A front desk that enters appointments and procedures with inconsistent coding makes any dashboard, no matter how sophisticated, useless.
Risk assessment and external economic variables
A dental practice does not operate in an environment isolated from general economic dynamics. Rising material costs, changes in interest rates on any financing for equipment, and changes in patient spending power are external variables that management control must be able to intercept quickly.
A good monitoring system does not limit itself to looking at internal practice data, but also tracks the trend of the treatment plan acceptance rate during periods of general economic uncertainty: a prolonged drop in this indicator, if not explainable by internal factors (clinical communication, price list), often signals a change in patient spending propensity that requires an adjustment of the commercial, not just clinical, strategy.
Diversifying revenue sources—for example, not relying excessively on a single high-cost clinical branch (such as implantology)—reduces the practice's exposure to external shocks in that specific treatment category.
Tax regulations and linked accounting obligations
Management control does not replace the practice's accounting and tax obligations; it works alongside them.
What management control adds is an interpretive reading of the data that tax accounting does not provide on its own: accounting tells you how much you billed and how much you have to pay in taxes, while management control tells you if that billing is generated sustainably or if it hides clinical branches operating at a loss.
It is helpful if the dental software produces reports compatible with the accountant's needs, reducing data exchange times between the practice and the tax consultant. Payment management integrated into the software also facilitates this step, keeping an orderly track of receipts and issued invoices.
Management control and clinical quality: a direct link
A frequent mistake is to think that management control only concerns numbers and not quality of care. In reality, the two aspects are closely linked: an organized front desk, a well-managed schedule, and reduced waiting times have a direct impact on patient satisfaction, which in turn translates into higher loyalty and a greater propensity to accept future treatment plans.
Monitoring the treatment plan acceptance rate is not just about measuring sales. A low rate can signal a clinical communication problem, overly rushed visit times, or a lack of clarity in presenting treatment options to the patient. Correcting these aspects simultaneously improves financial margins and the clinical experience.
Recalls, previously discussed as a recurring revenue lever, are first and foremost a clinical prevention tool. A patient recalled regularly for check-ups is less likely to develop complex and expensive pathologies to treat, a benefit reflected both in their health and in the long-term economic sustainability of the practice.
Perspective: the role of the practice owner in making the numbers work
No dashboard, no matter how well-designed, works if the owner does not read it regularly and translate the deviations into decisions. This is where many management control systems fail: not for lack of data, but for lack of an interpreter to turn it into action.
The involvement of the front office and associates is not an organizational detail; it is the condition that determines whether the data collected will be accurate or unusable. Those who enter appointments every day practically decide the reliability of the entire system.
The most underestimated benefit of management control is not the immediate increase in billing, but the scalability that allows for growth without losing control of clinical quality or margins, reducing the operational stress of those who lead the practice daily.
— Matteo
How Treatbase simplifies daily management control
Treatbase is designed for those who want to apply management control without adding hours of administrative work to their week. Voice charting eliminates manual transcription, while integrated invoice and payment management reduces the errors that normally make reports less reliable.

Some software programs offer an integrated financial dashboard that shows the practice's economic data without having to manually cross-reference accounting and clinical software, a root problem for many management controls that are never truly activated. The multi-chair schedule and automatic reminders can reduce no-shows, while data migration from the previous software can be simplified and require no operational downtime during the transition.
Anyone who wants to see in practice how integrated financial management works can request a live demo on the official Treatbase website and evaluate, with their own real data, how much time the front office could recover each month.
Sources
Frequently Asked Questions
What are the three phases of management control?
The three phases are data collection (billing, costs, appointments), analysis and reporting via a concise dashboard, and corrective action on identified deviations.
What are the tasks of management control?
Monitoring economic KPIs such as hourly profitability, chair saturation, and DSO, identifying deviations from the budget, and guiding operational decisions on scheduling, price lists, and costs.
What is the best dental practice management software?
There is no single management software that is right for all practices, but the key features to evaluate are a multi-chair schedule, integrated billing, automatic reminders, and a financial dashboard: Treatbase meets these requirements with voice charting that reduces administrative work.
What does the ASL check in a dental practice?
Health inspections verify compliance with hygiene and sterilization protocols, the maintenance of clinical records, and possession of the authorization requirements provided by regional regulations; these aspects remain distinct from financial management control, but orderly clinical documentation in the software also facilitates this type of audit.
How often should the management control report be updated?
The recommended frequency is monthly or quarterly, with a summary report of one or two pages that allows the owner to quickly identify the main deviations without analyzing dozens of documents.