Dental Practice Performance Analysis: Key KPIs to Measure First
Analyzing your dental practice starts with five key KPIs: estimates, no-shows, collections, new patients, and chair utilization. Find out how to calculate them.

Dental practice performance analysis: the top KPIs to measure first
An essential dashboard with 5 KPIs covers 80% of a practice's health: quote conversion, no-shows, collections vs. production, new patients, and chair occupancy. They are easy to read, tracked weekly for operational metrics and monthly for commercial and financial ones. The first step: choose them, write down their definitions, and schedule the monthly meeting.
In brief:
Define each KPI in writing, assign an owner and a single source of truth; calculate quote acceptance both by number and by value.
To evaluate profitability, separate fixed and variable costs, calculate the margin per procedure and per chair hour, then update the analysis quarterly.
Connect your practice management software, bank, and accounting to the dashboard to reduce manual errors; view trends, period-over-period comparisons, and color-coded thresholds, complete with automated alerts.
When quotes are rarely accepted, revisit how treatment plans are presented; if missed appointments rise, reinforce reminders and confirmations.
TreatbaseTrack practice performanceTreatbase brings together tools to monitor performance, manage billing, and send automated reminders to patients.Discover Treatbase
Table of Contents
Which KPIs to track and how to calculate them
Costs and margins per procedure: the practical method
How to build a dashboard that actually gets used
A 6-week operational plan to implement management control
Common mistakes and best practices that make KPIs work
Management control changes how decisions are made
How we automate KPIs and dashboards with Treatbase
Frequently Asked Questions
Sources
Which KPIs to track and how to calculate them
A good indicator requires three ingredients: a written definition, a reliable source, and an owner. Without one of these three, two people will interpret the same number differently, and the meeting will turn into a debate over data rather than decisions.
Here are the core KPIs to start with, along with their practical formulas:
Monthly production: total value of treatments delivered during the month, regardless of how much was collected.
Production per chair hour: monthly production divided by the chair hours actually worked.
Quote acceptance rate: accepted quotes divided by presented quotes, calculated both by number and by value.
Average treatment plan value: total value of accepted plans divided by the number of plans.
Chair occupancy and no-show rate: occupied hours over available hours; missed appointments over scheduled appointments.
Collections vs. production: amount collected during the period divided by the amount produced in the same period.
Add wait times for initial consultations, hygiene recalls, accounts receivable from patients, and projected cash flow. The data comes from your practice management system, bank statements, and accounting.
KPIs fall into economic, commercial, operational, and financial categories, and it is best to start with 5–7 indicators reviewed monthly, rather than twenty.
Costs and margins per procedure: the practical method
Revenue shows how much a practice works, not how much it earns. Management control exists specifically for this: to evaluate margins per procedure, dental lab costs, and associate compensation, and to adjust course throughout the year. Those who want to explore direct versus indirect costs in depth can read the cost and margin analysis.
Here is how to proceed:
Separate fixed costs (rent, salaried staff, depreciation, software) from variable costs (dental lab, consumables, percentage-based provider fees).
For each procedure, calculate the margin: price minus lab fees, minus materials, minus provider compensation.
Divide the margin by the chair time used: this gives you the hourly margin, the figure that allows you to compare a filling to a prosthetic.
Calculate the break-even point: fixed costs divided by the contribution margin percentage. Below that revenue level, the practice operates at a loss.
Review everything quarterly, as lab fees and compensation rates change.
A tip: start with your three most common procedures and your three most profitable ones: they often do not overlap, and the comparison immediately reveals where to focus scheduling and marketing efforts.
How to build a dashboard that actually gets used
A useful dashboard fits onto a single screen and answers three questions: how are our finances, how are operations running clinically, and what requires attention today? Because of this, we divide it into three sections:
Financial health: revenue, collections, and cash flow forecast.
Clinical performance: new patients, productive hours, and occupancy rate.
Alerts: rising no-shows and pending quotes requiring follow-up.
Each metric should show its historical trend and a period-over-period comparison, using color-coded thresholds (green, yellow, red) to make it clear at a glance where intervention is needed. Automated alerts handle the rest: no one has to remember to check.
An essential dashboard with 5 KPIs covers 80% of a practice's health: adding more metrics before mastering these five rarely improves decision-making.
The weak point is almost always manual data entry. Connecting your practice management system, bank statements, and accounting software minimizes transcription errors and frees up time; structured data collection then enables accurate performance tracking.
A 6-week operational plan to implement management control
A week-by-week roadmap prevents the most common pitfall: starting with enthusiasm and stopping by the second meeting.
Select your KPIs, write operational definitions, and designate an owner for each.
Collect the available data and calculate the baseline—the starting point against which you will measure progress.
Set up the dashboard, automate data extraction from your practice management and accounting software, and verify that the figures reconcile.
Hold the first meeting, analyze variances, and set an action plan with deadlines.
Turn the process into a routine and review the KPIs: keep those that drove decisions, and discard the rest.
A tip: during the first meeting, pick only one action item for each KPI outside its target threshold. Three completed initiatives are worth more than ten good intentions.
Common mistakes and best practices that make KPIs work
Numbers lose their value when the rules change midway through or when no one takes action. These are the most common pitfalls we see:
Changing a metric's definition from one month to the next, making comparisons impossible.
Using unverified data or pulling from multiple inconsistent sources.
Measuring without making decisions, turning the meeting into a hollow ritual.
Confusing production with collections: a practice can have high production while still facing severe cash flow shortages.
Best practices are equally straightforward: written definitions, a single source for each data point, clear accountability, and a monthly meeting. When quote conversion is low, review how treatment plans are presented; when no-shows are high, strengthen reminders and confirmations; when collections lag, review payment terms and outstanding receivables.
Management control changes how decisions are made
Management control is not an accounting exercise; it is an operational tool: it helps identify where the practice truly makes money and where it consumes time and resources. Shared definitions make discussions within the team and with associates far more constructive.
— Matteo
How we automate KPIs and dashboards with Treatbase
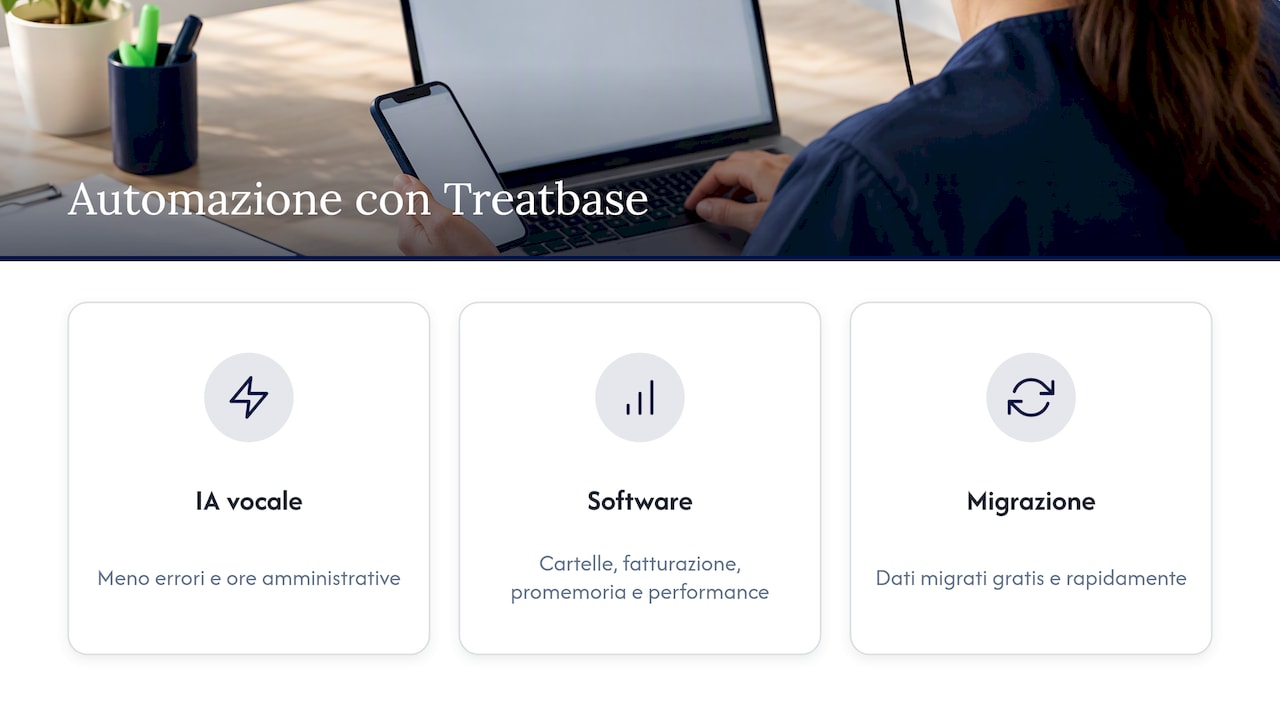
Collecting data manually makes sustaining management control over time much harder. With Treatbase, we eliminate manual data entry using voice AI, resulting in fewer errors and fewer administrative hours. The platform includes electronic health records, billing, automated patient reminders, and performance tracking. Data migration is fast and free.

To learn more about our dental practice management software, visit the dedicated page.
This article provides general information and does not replace the advice of a qualified financial consultant. Consult a qualified financial professional regarding your specific situation before acting on this content.
Frequently Asked Questions
What does the local health authority (ASL) inspect in a dental practice?
Inspections generally cover structural, hygiene-sanitary, and organizational standards of the clinic. Regulations vary by region, so it is advisable to consult your local health authority or professional association for the most up-to-date checklist.
How is the value of a dental practice calculated?
Multiple valuation methods are combined: asset-based, income-based, and market multiples. It is also essential to analyze margin stability and the level of reliance on the principal dentist's personal patient base.
How much does a dental practice earn per month?
It depends on production, costs, and associate compensation; revenue alone does not reflect true profitability. To determine this for your specific situation, calculate your margin per procedure and break-even point.
What is the best practice management software for a dental clinic?
The best software is one that captures data without manual effort and turns it into reliable indicators. Look for a solution that handles billing, reminders, patient records, and performance tracking in a single system.