Digital periodontal chart: what to record and how to compare it over time
Find out how the digital periodontal chart records PD, CAL, and BOP to compare measurements over time and monitor periodontitis and treatment response.
Digital periodontal chart: what to record and how to compare it over time
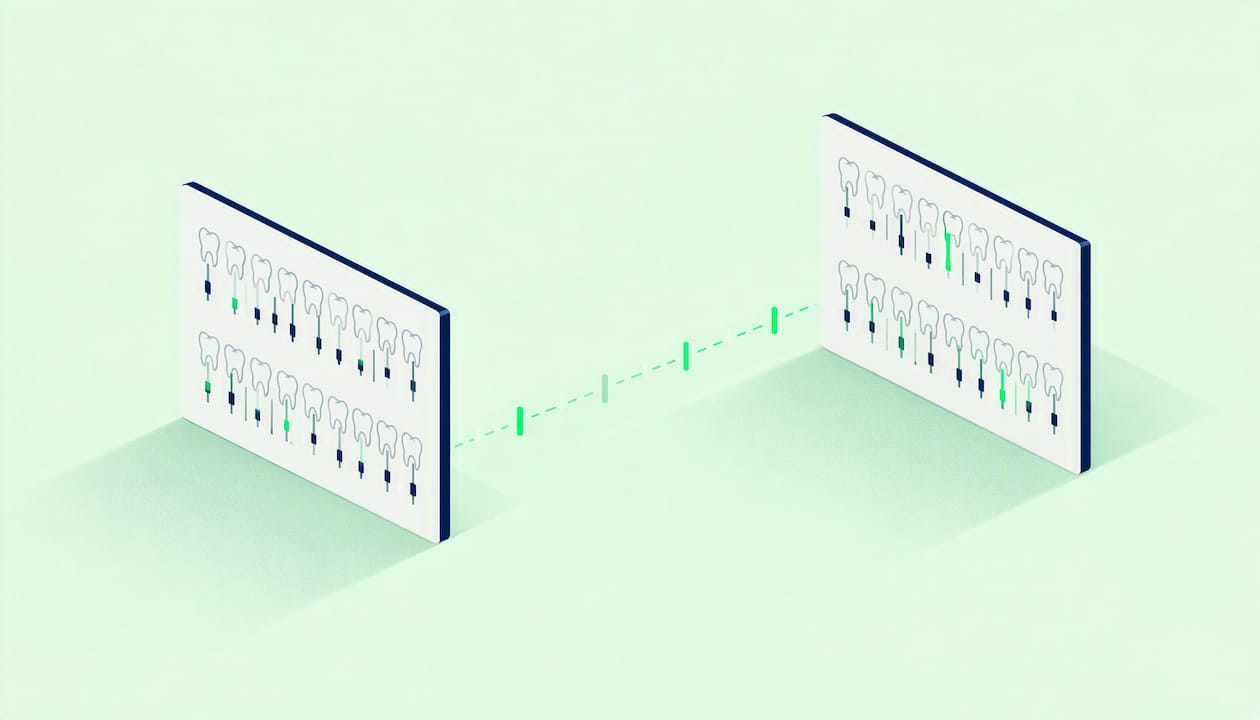
A digital periodontal chart is the structured and dated recording of PD, CAL, and BOP that allows monitoring periodontitis over time and evaluating response to treatment. It only holds clinical value if measurements are repeatable: probe, force, and technique must be standardized, in line with EFP and AAP references. This is the working methodology we placed at the core of Treatbase.
In brief:
Count PD ≥4 and ≥6 mm and CAL ≥3 and ≥5 mm; in smokers, interpret BOP with caution even when bleeding is absent.
Before importing historical data, standardize the probe, force, and technique, periodically calibrate staff, and record operator and instrument at each session.
Before signing the report, check for missing sites, out-of-scale values, and consistency between threshold counts and dental maps.
Diagnosis also requires medical history, clinical examination, and radiographs: the periodontal chart maps the periodontium, but does not replace these elements.
TreatbaseRecord periodontal probing by voiceTreatbase uses voice artificial intelligence to simplify periodontal charting and reduce manual transcription in the dental practice.Discover Treatbase
Table of Contents
Which parameters to record and with which thresholds
How to standardize probe, probing force, and technique
Features that make a digital periodontal chart useful
Longitudinal comparison and quality control in the workflow
How to introduce the digital periodontal chart into the practice
Integration with other dental practice management modules
Real-time data updates and synchronization across devices
Training and support to make effective use of the periodontal chart in Treatbase
Why voice artificial intelligence simplifies periodontal charting
Security and privacy of periodontal data
What really matters: my take on the digital periodontal chart
How practice management software with periodontal charting simplifies practice operations
Frequently Asked Questions
Sources
Which parameters to record and with which thresholds
The core of the periodontal chart is probing depth (PD) measured at dental sites, from which clinical attachment level (CAL) is derived. Pocket probing is often sufficient to guide diagnosis: pockets deeper than 4 mm raise suspicion of periodontitis. Bleeding on probing (BOP) indicates inflammation, and its absence is considered a criterion for stability; in smokers, however, interpretation requires caution.
EFP documentation uses counts of sites exceeding thresholds (PD ≥4 mm and ≥6 mm, CAL ≥3 mm and ≥5 mm) and incorporates BOP into the diagnostic framework. For daily use, it is best to establish these data points:
PD at dental sites, in millimeters, with counts of sites ≥4 mm and ≥6 mm.
CAL per site, calculated by the software, with thresholds of ≥3 mm and ≥5 mm.
BOP per site, always recorded alongside PD.
Mobility and furcations, reported per tooth.
FMPS and FMBS, the percentages of sites with plaque and with bleeding, useful as summary indicators for a session.
How to standardize probe, probing force, and technique
In the digital environment, measurement error does not disappear: it becomes fixed in the data and distorts every subsequent comparison. The American Academy of Periodontology notes that probing pressure influences the reproducibility of depth values, and therefore recommends standardizing probe, force, and technique. The EFP adds that millimeter variability depends on the probe, operator, and technique, and advises using the same type of probe across an entire series of measurements.
In practice, a minimal protocol relies on these points:
Choose a single type of probe for the practice and for follow-up series.
Periodically calibrate operators by comparing repeated measurements on the same patient.
Document the probe used, the operator, and any automated instrument at each session.
Establish a single criterion for fulcrum and probing force.
Spot-check concordance between hygienists and dentists before comparing data from different operators.
A piece of advice: when switching from paper to digital, standardize your technique before importing historical data, so you do not carry errors into the new system that later look like clinical deterioration.
Features that make a digital periodontal chart useful
A digital chart is clinically useful when it turns measurements into information readable at a glance. The features that truly matter are:
Dental maps: a graphic representation of the dentition helps in reviewing recorded values.
Organized clinical data: the software facilitates consulting the values recorded in the chart.
Sites above threshold: the site count can assist in staging assessment.
Comparison across different dates: visit data can be compared to assess the progression of pockets.
Clinical report: documentation can be reviewed while explaining findings to the patient.
The integration of these features adheres to the principle that diagnosis requires medical history, periodontal clinical examination, and imaging: full-mouth probing builds the periodontal map and the digital chart makes it accessible and repeatable.
Longitudinal comparison and quality control in the workflow
Longitudinal comparison only makes sense if the data are consistent. Following treatment, the periodontal chart should demonstrate PD reduction, BOP improvement, and CAL gain. The EFP guidance on the decision-making process describes staging and grading as a path requiring a periodontal chart, full-mouth radiographs, and a history of tooth loss.
Before concluding a session, a quick check avoids upstream errors:
check for out-of-scale values or values inconsistent with those from the previous visit;
look for incomplete sites, namely teeth with missing measurements;
ensure threshold summaries (sites ≥4 mm and ≥6 mm) match the maps;
confirm the data before signing the report.
A benchmark worth remembering: in the World Workshop, diagnosis is multidimensional and includes CAL, bone loss, PPD, and percentage of bleeding sites; therefore, none of these data points can be missing from the chart.
How to introduce the digital periodontal chart into the practice
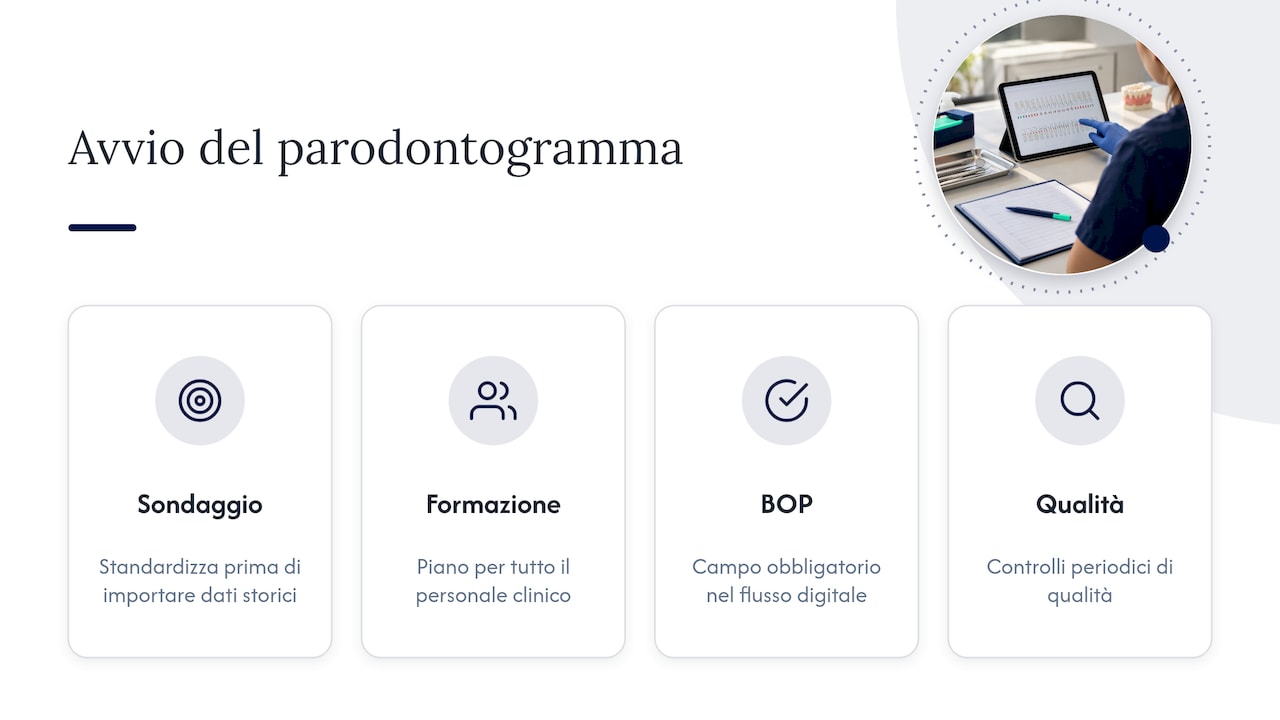
The order of priorities is clear. First standardize probing technique, then import historical data. A training plan for all clinical staff is necessary, along with periodic quality checks. BOP must be made a mandatory field in the digital workflow: without it, clinical comparisons lose validity. A short setup checklist shared among hygienists and dentists is worth more than a lengthy manual.
Integration with other dental practice management modules
An isolated periodontal chart remains a mere document; integrated into practice management software, it becomes part of the patient's record. In Treatbase, charting interacts with other modules: the clinical file, appointment calendar, billing, and automated reminders. This can help reduce the need to copy recorded data elsewhere during the appointment.
Concrete benefits include continuity: when scheduling a maintenance recall, the previous periodontal chart is already linked to the patient and ready for comparison. Another is consent: digital signing and archiving of consent forms exist within the same environment as clinical documentation.
For the hygienist, integration translates to fewer steps between screens; for the practice owner, into structured data that also feed performance analytics. When the periodontal chart is built into the management software, comparing dates becomes a routine operation rather than a task of retrieving files across different locations.
Real-time data updates and synchronization across devices
Our software is cloud-based, supporting the practice's work across its devices. This changes the way a practice operates with multiple workstations or locations.
A hygienist can complete the charting while the dentist reviews the patient's record. Reception can use the software to organize clinic schedules. In a multi-location practice, the management system can support reviewing patient history across sites.
Continuous synchronization also reduces the risk of divergent versions of the same document, a common issue when data are saved locally and merged later. Software updates, being centralized, reach all users simultaneously without having to manage installations workstation by workstation. This matters for data quality: a single version of the record means a single source of truth for longitudinal comparison.
Training and support to make effective use of the periodontal chart in Treatbase
A digital tool delivers value only if the team uses it consistently. That is why we support onboarding with a tailored workflow designed for clinic routine, combining technical and clinical aspects.
Practically speaking, we work on multiple fronts. The first is configuration: we define with you which fields are mandatory, such as BOP, and how threshold summaries are displayed. Another is data migration, which is free and fast with us, allowing patient history to enter the system without disrupting daily operations.
The recommendation remains the one already given: before importing bulk data, align your probing technique. Our support team helps you do this smoothly, with a brief team calibration session and a checklist for the first few weeks of use until the new workflow becomes second nature.
Why voice artificial intelligence simplifies periodontal charting
Full-mouth probing requires numerous dental measurements, plus BOP and other data points. Dictating values aloud avoids taking hands off the probe to type or write, freeing the hygienist from transcription that interrupts the flow of the appointment.
In our practice management system, voice AI enables hands-free charting. Clinicians dictate measurements and the system enters them directly onto the patient map, eliminating manual transcription and paper records. The benefits are evident across several areas. Fewer interruptions: the operator keeps focus on the patient and the probe. Fewer transposition errors: data move from voice to chart without intermediate transcription. More complete data: with a rapid workflow, skipping sites or forgetting BOP is less likely.
The rule of standardization still applies: voice speeds up recording, but it does not correct an inconsistent probing technique. For this reason, it is advisable to combine dictation with a shared protocol and a final review of out-of-scale values before confirming the report.
Security and privacy of periodontal data
A periodontal chart contains health data—information requiring high-level protections. In a practice transitioning to digital, access control, document storage, and proof of patient consent deserve close attention.
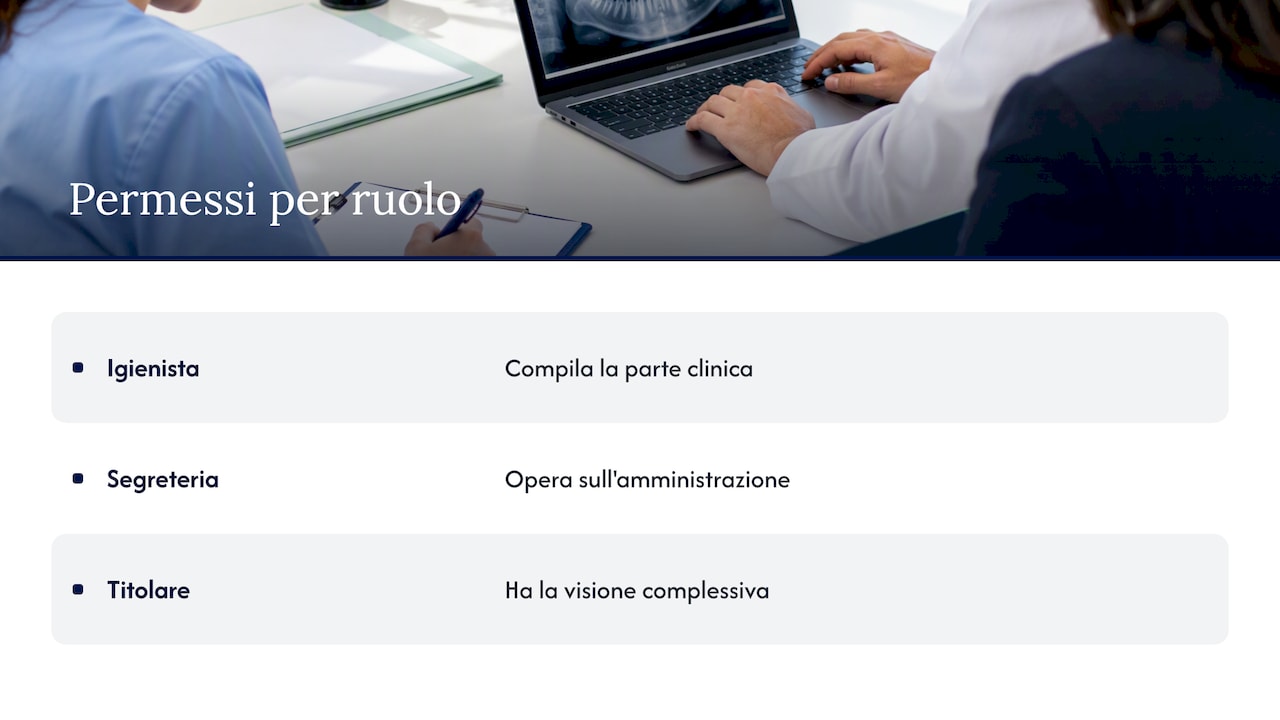
Staff and permission management allows restricting access based on roles: the hygienist views and completes the clinical section, reception handles administration, and the practice owner maintains overall oversight. A centralized digital archive prevents scattered copies on local computers and unmonitored devices. Digital signatures on consent forms and their storage alongside patient records ensure full traceability.
As with any processing of health data within the European Union, GDPR rules apply: privacy notices to patients, defined purposes, and tracked access. We encourage you to verify overall practice compliance with your consultant, as technology aids but does not replace internal procedures. Good management software simply makes these procedures easier to apply every day.
What really matters: my take on the digital periodontal chart
A widespread belief is that digitizing inherently improves data quality. It does not: digital makes data easier to read, compare, and store, but leaves it exactly as it was measured. A probe used with varying forces produces different numbers, and the screen displays them with identical confidence.
That is why the starting point is not the software, but the protocol. First, decide which probe to use, how to calibrate the team, and which fields can never remain blank—BOP above all. Only then does it make sense to appreciate maps, automatic calculations, and side-by-side comparisons, which become reliable tools because they rest on repeatable measurements.
Compared to how much it is discussed, I think elegant graphics are overrated; while end-of-session quality control, which takes just a few minutes and protects the validity of follow-up, is sorely underrated. If I had to single out one priority: standardize before digitizing, then let technology do what it does best—remember and compare.
— Matteo
How practice management software with periodontal charting simplifies practice operations
A well-crafted periodontal chart needs a supportive environment. With Treatbase, we built cloud-based practice management software where hands-free periodontal charting sits alongside clinical records, calendar, billing, and reminders, bringing entries, reports, and recalls together in one place.
Here is what changes in daily practice:
structured and dated data, ready for longitudinal comparison across visits;
less bureaucracy, as voice dictation replaces manual transcription;
fast, free data migration to get started without interrupting clinic workflow;
user and permission management for single practices or multi-location clinics.
If you want to evaluate how it would fit into your workflow, explore our dental practice management software and request a demo: testing it on your own clinical cases speaks louder than any description.
Frequently Asked Questions
Must BOP always be recorded in the periodontal chart?
Yes, it should be recorded at every appointment, because bleeding on probing indicates inflammation and its absence is a criterion for stabilization. In smokers, interpretation requires more caution. It is best configured as a mandatory field in the digital record.
How can inter-operator variability be minimized?
By using the same type of probe, an agreed probing force, and regular team calibrations, as recommended by AAP guidelines. Noting the probe and operator at each session makes comparisons more dependable.
What should a periodontal chart report include?
It should include the date, PD and CAL per site, BOP, mobility, furcations, and FMPS and FMBS summary indices. The count of sites above threshold helps summarize disease severity. Exporting to PDF simplifies archiving and sharing with the patient.
Is the periodontal chart alone sufficient for diagnosis?
No. Diagnosis also requires medical history, clinical examination, and radiographic imaging, as outlined in diagnostic guidelines. The periodontal chart provides the map of the periodontium onto which the rest is integrated.