Financial reports for the dental practice: what to really measure
Discover how your dental practice's financial reports highlight adjusted profit, cash flow, and 5 KPIs to take action during the quarter.

Financial reports for the dental practice: what to really measure
A useful financial report for your practice must show the real adjusted profit, updated cash flow, and five operational KPIs: yield per dental chair, collections versus turnover, no-show rate, treatment plan conversion, and margin per clinical area. The right frequency is quarterly, with a daily check on collections. Measure these three elements and you will be able to act within the quarter, not next year.
In brief:
A quarterly check allows you to intervene promptly on profits, collections, and operational KPIs, avoiding structural imbalances in the practice's performance.
The cost map must distinguish between fixed, variable, direct, and indirect costs, in order to correctly allocate expenses to the clinical areas they originate from.
Monitoring yield per chair, collections vs turnover, no-show rate, conversion, and margin per clinical area allows you to quickly identify potential critical issues.
The cash flow statement according to OIC 10 clarifies that accounting profit can hide liquidity problems, which must be carefully managed within the cash flow.
Electronic invoicing is not mandatory for services rendered to individuals, but it must be correctly set up for different entities and non-healthcare services to comply with privacy and tax regulations.
Treatbasetreatbase.comClearer numbers for your practiceTreatbase brings together invoices, collections, and performance monitoring to help you better manage the financial situation of your dental practice.Discover Treatbase
Table of Contents
Cost classification: fixed, variable, direct, and indirect
Daily management of collections and reconciliation with turnover
Management control: which KPIs to monitor and how to read them
Cash flow statement and cash flow: why profit is not enough
How much you really earn on a treatment: a practical example
Frequent mistakes and levers to increase profitability without raising prices
Tax and practical aspects on invoicing healthcare services
Comparing reports year-over-year to identify real trends
Digital tools for the financial management of the practice
How to build the annual budget and plan expenses
Compliance and financial transparency for medical and dental practices
Linking the financial report to staff and equipment
Why numbers matter more than feelings
How Treatbase simplifies reporting, dashboards, and collection reconciliation
Frequently Asked Questions
Sources
Cost classification: fixed, variable, direct, and indirect
Before building any report, you need a clear map of expenses. Fixed costs do not depend on the number of patients treated: rent, basic staff salaries, equipment depreciation. Variable costs grow with clinical activity: consumables, dental laboratory share, overtime.
Direct costs must be allocated to the single chair or the clinical area that generates them, not spread blindly across all turnover.
Indirect costs are distributed in proportion to the actual use of each chair, calculated on the hours of occupancy.
In the management software, it is best to label each expense item with a code consistent with the report categories, so that monthly extraction becomes automatic.
A practice is financially sustainable when it produces a real adjusted profit between 10% and 20% of turnover, with a quarterly check that allows for intervention before the imbalance becomes structural.
Daily management of collections and reconciliation with turnover
Daily cash closing is where most of the practice's accounting errors originate. A fixed procedure is required, not improvised by the receptionist on duty.
Sum collections by payment method: cash, POS, bank transfers, and checks separated.
Record credit notes issued on the same day they are generated.
Compare the total collected with the treatments provided that day, reporting any discrepancy above a minimum threshold.
Archive the signed closing sheet by whoever carried out the check.
On a monthly basis, reconcile collections with the issued turnover: a practice can close the month with an accounting profit and still have a cash gap if collections lag behind invoices. Automating this comparison in the management software reduces manual errors and makes it harder for small frauds to go unnoticed.
A tip: set a tolerance limit (for example €50) above which any discrepancy must be investigated on the same day, not at the end of the month.
Management control: which KPIs to monitor and how to read them
A report listing dozens of numbers without priority does not help anyone make decisions. Five indicators are enough for most practices:
Yield per chair: turnover generated by each dental chair in a period, the primary thermometer of clinical productivity.
Collections versus turnover: the difference indicates payment delays or reconciliation issues.
No-show rate: percentage of appointments missed without notice, directly linked to yield per chair.
Treatment plan conversion: share of treatment plans accepted compared to those proposed.
Margin per clinical area: what remains, after direct costs, for each department (restorative, prosthodontics, implantology).
An effective dashboard is simple, shows real-time data, and includes automatic alerts for critical thresholds: when the yield per chair falls below a set level, a visual signal (green, yellow, red) warns the owner before the problem accumulates over multiple months.
Always prefer the quarterly trend over the single monthly reading: a weak month may depend on holidays, non-working days, or a single patient postponing an important treatment plan, while three consecutive months in decline tell a real trend. The industry benchmarks on yield per chair indicate how organized practices more easily exceed the technical reference thresholds, often placed above 20,000 euros per chair in the period considered: a useful piece of data to decide whether to invest in a new chair or in a renovation of the existing space.
For visualization, a bar chart for the monthly yield per chair and a line chart for the quarterly trend of the five KPIs are sufficient: avoid pie charts with too many categories, which are difficult to read at a glance during a practice meeting.
Cash flow statement and cash flow: why profit is not enough
The accounting standard OIC 10 defines the cash flow statement as the tool to assess actual liquidity, distinguishing three categories of flows: operating activities (ordinary clinical activity), investing activities (equipment, renovations), and financing activities (loans, capital contributions). The standard recommends always presenting the change in cash and cash equivalents, not just the accounting result.
The practical reason is simple: a practice can close the quarter with a profit and still have little available cash, because collections from patients or insurance companies arrive late compared to invoicing. An updated statement allows you to identify this imbalance before it becomes a real liquidity problem.
When cash flow is negative for several consecutive months, some corrective actions work better than others:
Delay non-urgent investments in equipment, even if already planned.
Renegotiate payment terms with main suppliers, particularly the dental laboratory.
Review collection policies towards patients, for example, by requiring higher advances on complex treatment plans.
How much you really earn on a treatment: a practical example
Let's take an illustrative case: a ceramic crown invoiced at €800. Here is how to arrive at the real margin.
Invoiced revenue: €800.
Materials cost and laboratory share: €220.
Chair time: 90 minutes at an estimated hourly cost of €60 (rent, utilities, distributed depreciation) = €90.
Staff share (hygienist or assistant involved): €60.
Adjustment for the owner's time, often omitted: €100.
Margin before taxes: 800 minus 470 of total costs, equal to €330, or about 41% on the turnover of the single treatment.
Such a high margin on a single item is normal: the point is to compare the practice average with the sustainability threshold of 10-20% on overall turnover, because other treatments (hygiene, check-ups) have much lower margins and lower the general average. Automating this calculation in a spreadsheet linked to the management software, with standard costs already pre-filled, avoids having to do it by hand for each treatment.
Frequent mistakes and levers to increase profitability without raising prices
The owner who does not value their own time in the cost calculation systematically underestimates the real profitability of each treatment. It is the most common mistake, along with poor reconciliation between collections and turnover, which leaves payment delays uncovered for months.
KPIs are calculated but not looked at during meetings: a number that no one reads changes no decisions.
The waste of clinical materials, often due to unplanned orders on actual consumption, silently erodes margins.
The mix of services remains unchanged for years, without promoting higher-margin ones when demand allows.
The interventions with the quickest return are three: reducing the no-show rate with automatic reminders, improving treatment plan conversion with a second interview dedicated to the most expensive plans, and reviewing material orders on a monthly basis rather than by feeling.
A tip: start with the KPI you already collect but never look at: often it is the treatment plan conversion, and just one month of attention is enough to see a measurable improvement.
Tax and practical aspects on invoicing healthcare services
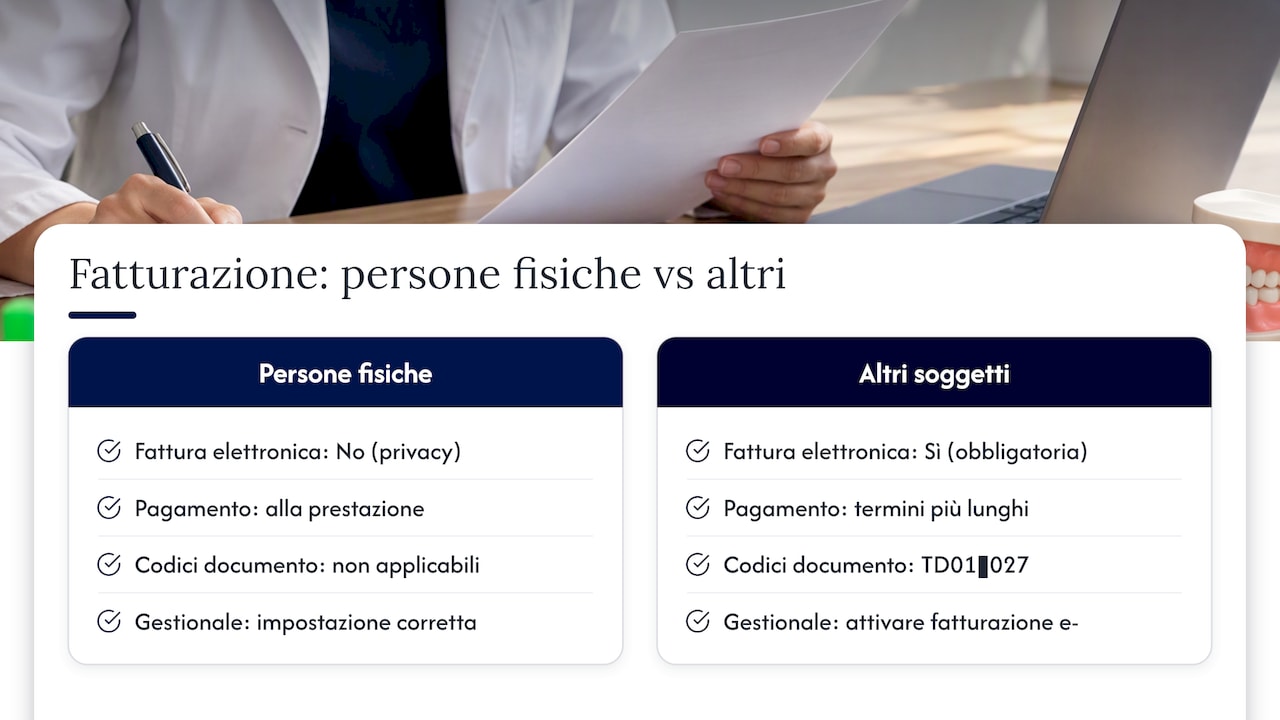
A point that frequently generates confusion concerns the obligation of electronic invoicing for dental services. According to the ruling of the Revenue Agency no. 103/2019, healthcare services rendered to individuals must not be documented via electronic invoice transmitted through the Exchange System, precisely to protect the confidentiality of patients' health data. The obligation of electronic invoicing remains valid for entities other than individuals, such as companies or organizations, and for non-healthcare services provided by the same practice.
This distinction must be correctly reported in the management software, because an incorrect setting generates electronic invoices that should not exist, with the risk of violating the confidentiality of health data. The Revenue Agency Guide to filling in electronic invoices also clarifies the document codes (TD01-TD27) useful when the practice issues invoices to entities other than individuals.
In the quarterly report, it is worth separating turnover from individuals from that of other entities, not only for tax reasons but because collection flows and payment times are often very different between the two categories: private patients almost always pay upon treatment, while companies or insurance companies may have longer payment terms that must be monitored separately in the cash flow.
Comparing reports year-over-year to identify real trends
A single quarter tells little if it is not compared with the same period of the previous year. The seasonality of the dental practice is real: January and August tend to be weaker everywhere due to holidays and returns from vacations, while spring and autumn concentrate the demand for more complex treatment plans.
To make the comparison useful, keep the structure of the report fixed from one year to the next: same cost categories, same KPIs, same definition of margin. Comparing numbers calculated with different methods leads to wrong conclusions, even when the starting data are correct.
Some signs deserve attention when looking at the year-over-year comparison:
A drop in yield per chair in the same quarter of two consecutive years, which excludes seasonality as a cause.
A margin per clinical area growing in one department and constantly falling in another, a sign of a service mix to be reviewed.
A no-show rate that grows despite the introduction of automatic reminders, which suggests a problem other than communication alone.
Historical comparison works best when the management software preserves data consistently over time: changing system or service code structure mid-year makes it complicated to rebuild reliable historical series, precisely when they would be needed to decide on an investment or a course correction.
Digital tools for the financial management of the practice
The choice of tool depends on the size of the practice and the level of automation that is actually needed. A well-structured spreadsheet works for a practice with a single owner and few chairs, provided that someone updates it with discipline every week: the main problem is not the format but the consistency in data entry.
For practices with multiple associates or multiple locations, a management system that automatically extracts KPIs from recorded treatments drastically reduces the time dedicated to manual reporting and, above all, eliminates transcription errors that accumulate when data passes from one sheet to another. The practical difference is seen in the speed with which the owner can answer a simple question like "how much did we collect this month compared to turnover" without having to wait for someone to rebuild the numbers by hand.
Whichever tool you choose, three features matter more than others: real-time updates of cash data, the ability to segment costs by clinical area or by chair, and the exportability of reports in a format that can be shared with the accountant. A tool that keeps everything locked in a proprietary format complicates the work of those who must then draw up the financial statements.
How to build the annual budget and plan expenses
The annual budget starts from historical data, not from abstract objectives dropped from above. The most solid starting point is the turnover and costs of the previous year, adjusted for already known changes: a new associate joining in March, a rental contract renewing under different conditions, equipment that needs to be replaced.
Once the base is fixed, the budget is built by items homogeneous with the categories already used in the quarterly report: fixed costs, variable costs, planned investments. This alignment allows for comparing the budget with real results quarter by quarter, without having to translate different categories each time.
Investments in equipment deserve a separate line in the budget, because they have a direct impact on cash flow even when they do not modify the accounting profit of the same period, due to depreciation. Planning the purchase of a new chair or a radiographic system in time avoids having to do it in an emergency, when payment conditions are almost always less favorable.
Once a year, it is also worth reviewing the alarm thresholds of the operational dashboard: if the practice has grown, a yield per chair threshold set two years earlier might now be too low to be a useful signal.
Compliance and financial transparency for medical and dental practices
Internal management control does not replace the compliance obligations that affect a dental practice, but completes them. The accountant remains responsible for bookkeeping and tax compliance, but is not automatically responsible for daily operational control: it is up to the owner to request specific management indicators, such as net operating margin or return on investment, to have a complete picture beyond the annual balance sheet.
Financial transparency towards any partners in the practice, when present, goes through the same quarterly report described in this article: sharing adjusted profit, cash flow, and the five operational KPIs with all owners involved avoids misunderstandings that almost always arise from a different reading of the numbers, not from a discussion on clinical choices.
On the level of health data confidentiality, the distinction already seen on electronic invoicing remains central also from a compliance perspective: correctly treating patient data in the invoicing system is not only a regulatory obligation, it is also a guarantee that the financial report itself does not become an involuntary vehicle for sensitive health information, especially when shared with external consultants or other partners.
Linking the financial report to staff and equipment
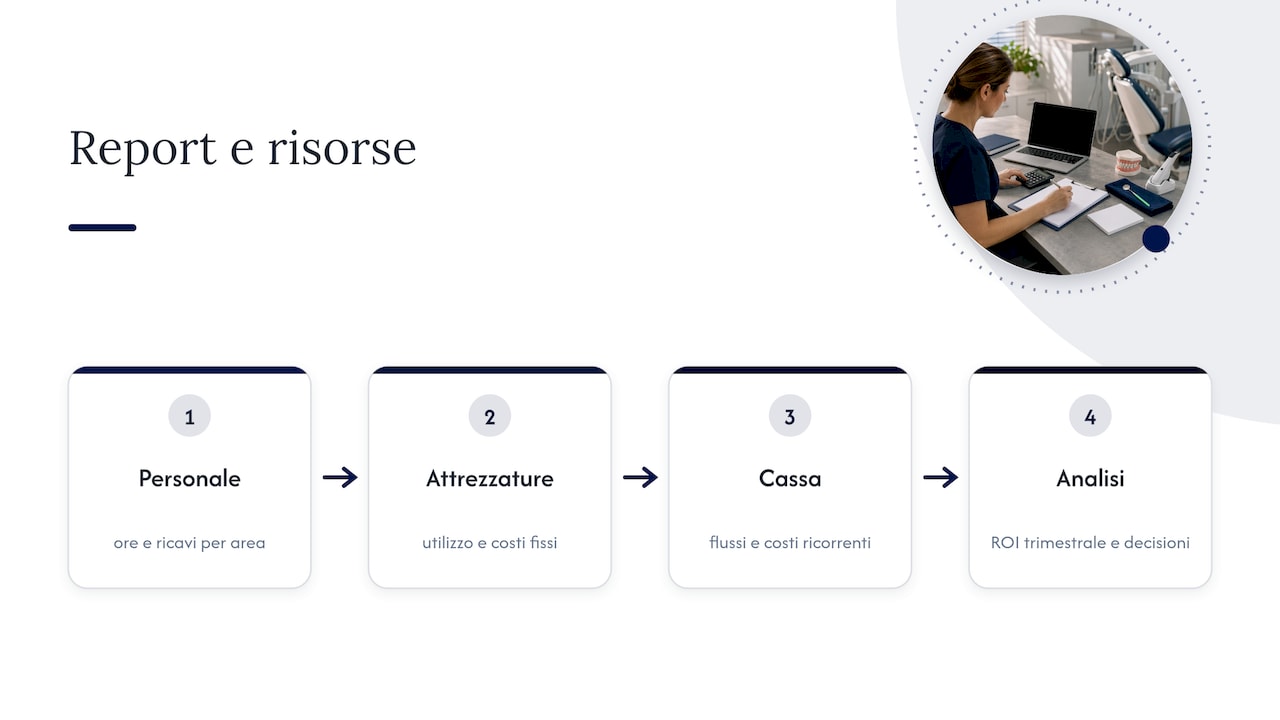
The most useful financial reports do not live isolated from decisions on staff and investments: a declining margin per clinical area often depends as much on material costs as on the number of hours an associate dedicates to low-margin treatments compared to more profitable ones.
Linking data on hours worked by each associate to revenues generated in the same clinical area allows you to understand if a department is in difficulty due to the mix of treatments or due to a specific productivity problem. The same applies to equipment: an underutilized dental chair weighs on the fixed costs allocated per chair, and the quarterly report should signal this inefficiency before deciding whether to open a new location or purchase another.
When evaluating an investment in new equipment, the cash flow statement described above helps estimate in how many quarters the investment pays for itself, crossing the cash flow generated by the treatments that equipment makes possible with the initial outlay and recurring maintenance costs. This type of integrated analysis, which combines staff, equipment, and cash data in the same report, is what distinguishes a truly operational management control from a simple annual balance sheet read once and archived.
Why numbers matter more than feelings
Many owners postpone reporting because they fear it requires too much time or skills they do not have. In practice, a minimal report with three or four key numbers read every quarter beats a comprehensive report that no one ever opens.
A tip: start with the smallest report possible: adjusted profit, cash flow, yield per chair. Add one KPI at a time only when the previous one has become a reading habit.
— Matteo
How Treatbase simplifies reporting, dashboards, and collection reconciliation
Building these reports by hand, month after month, is the main reason why many owners end up not looking at them anymore. We work so that the data needed for management control, yield per chair, collections versus turnover, margin per clinical area, are automatically generated from the treatments already recorded in the calendar, without manual steps between different sheets.
We gather in a single system the features that this article has described as necessary for robust reporting:
Dashboard with operational KPIs updated in real-time, ready for quarterly reading.
Reconciliation between recorded collections and issued invoicing.
Invoice and payment management integrated with the clinical calendar.
Data migration from the current management software, without additional costs or operational interruptions.
To see in practice how we set up financial reports and dashboards, the guide on financial management and practice situation shows the real interface step-by-step. Anyone wishing to evaluate the management software as a whole can start from the Treatbase product page to request a demo and check if it meets the specific needs of their practice.
Frequently Asked Questions
How often should the practice's financial report be prepared?
The recommended frequency is quarterly for the complete analysis of KPIs and margins, accompanied by a daily check of collections to avoid discrepancies that accumulate over time. The quarter allows you to distinguish a real trend from a seasonal fluctuation of a single month.
What is the difference between accounting profit and cash flow?
Accounting profit measures revenues minus costs in the period, while cash flow measures the liquidity actually available in cash. A practice can close in profit and still have little cash if patient collections arrive late compared to invoicing.
What is a reasonable profit margin for a dental practice?
A practice is considered financially sustainable with a real adjusted profit between 10% and 20% of turnover, calculated after also correctly valuing the owner's time. Margins outside this range deserve an analysis by clinical area to understand where value is being lost.
Do healthcare services always require an electronic invoice?
No: healthcare services rendered to individuals must not be documented via electronic invoice through the Exchange System, to protect the confidentiality of health data. The obligation remains for entities other than individuals and for non-healthcare services.
Which KPIs should I look at first if I have never done reporting?
Start with yield per chair and the ratio between collections and turnover: they are the two numbers that most quickly reveal if there is a clinical productivity or cash management problem. A simple dashboard with automatic alerts makes it easier to notice when one of these values falls outside the acceptable threshold.