Multi-site dental clinic report: what it must contain to be useful
Monitor multiple locations with a centralized dashboard: 5–6 key metrics, weekly updates, and one manager per location for quick decision-making.

Multi-site Dentistry Report: What It Must Contain to Be Useful
Those who manage multiple locations do not need more numbers: they need a centralized dashboard with five or six key indicators (treatment plan conversion, chair saturation, operating margin, DSO), updated at least weekly and with a manager for each location who is accountable for them. A dental management system can automatically feed this data without manual transcriptions, but the report structure matters more than the tool that produces it.
In brief:
To manage multiple locations effectively, a dashboard with a few key KPIs updated weekly is necessary, such as treatment plan conversion, chair saturation, and operating margin.
The optimal report structure includes executive, operational, and financial view levels, with time series analysis and heatmaps to identify anomalies before they affect liquidity.
Migrating to a unified system must follow a process of audit, testing, role governance, and progressive rollout, avoiding simultaneous changes to multiple variables.
Using automatic dashboards and consolidated data allows for faster, personalized, and concrete action-oriented decisions, reducing inefficiencies hidden by overall revenues.
TreatbaseManage multiple locations with unified dataTreatbase helps dental groups standardize clinical records and billing across sites, with consolidated data and less bureaucracy.Discover Treatbase
Table of Contents
Which KPIs to Include in the Multi-site Dentistry Report
How to Design an Effective Multi-site Dashboard
How to Turn Reports into Operational Decisions
Implementation and Data Migration Checklist for Multi-site Reporting
Why a Data-driven Approach Makes the Difference in Multi-site Practices
How Treatbase Activates Multi-site Dashboards and Migration Without Stopping the Practice
Sources
Frequently Asked Questions
Which KPIs to Include in the Multi-site Dentistry Report
A working multi-site dentistry report starts with a few indicators, measured the same way at every location. The management control of the dental practice identifies treatment plan conversion rate, chair saturation, operating margin per location, and collection times as the four pillars of any management dashboard.
Treatment plan conversion rate: accepted treatment plans divided by presented treatment plans, by operator and by location. Below 40% signals a clinical communication or pricing problem, not a marketing one.
Chair saturation: billable hours occupied divided by available hours. Saturation levels below an effective threshold can indicate a reduction in hourly profitability without changes in fixed costs.
Operating margin per location: revenue minus variable costs and allocated share of fixed costs. It is the number that reveals whether a location "full of patients" is actually making money.
DSO (Days Sales Outstanding): average time between treatment and actual payment. A DSO that rises by 10 days across multiple locations anticipates a liquidity crisis before it shows up in the bank.
Quality and recall KPIs: percentage of patients recalled for hygiene or check-ups who return within the scheduled time, because it generates recurring revenue without acquisition costs.
A tip: do not set identical thresholds for locations that are very different in terms of the number of chairs. The analysis of cluster VK21U of the Revenue Agency shows that the presence of multiple locations is itself a distinctive variable among practices. Comparing a single-chair practice with a five-chair facility without adjusting for size leads to incorrect conclusions.
How to Design an Effective Multi-site Dashboard
The right structure has three levels, not one. An executive dashboard shows consolidated KPIs and 3, 6, and 12-month trends: it is for those deciding whether to open or close a location, not for those managing Monday's schedule. Below that level, a drill-down panel is needed that goes from location to operator, from operator to chair, from chair to single treatment.
Executive view: consolidated KPIs, time trends, comparison between homogeneous locations by size cluster.
Operational view: daily chair saturation, daily schedule, waiting queues.
Financial view: margin per location, DSO, fixed cost incidence month-on-month.
Time series work better than static tables for spotting a drop in saturation before it becomes a cash flow issue. Heatmaps by time slot and day of the week reveal gaps in the schedule that no monthly total shows. Treatment plan conversion funnels, from first contact to acceptance, isolate where the patient is lost.
A tip: *set automatic alert thresholds, not just colors on the dashboard.
Data must be integrated from accounting, scheduling, inventory, and payment systems into a single flow, with updates at least weekly: monthly is fine for margins, too slow for saturation.
How to Turn Reports into Operational Decisions
A number without a linked action is just a decorative data point. The Clinic Manager reminds us that management control serves to translate indicators into interventions, not to produce monthly PDFs to archive.
Low saturation in a specific location: before hiring staff elsewhere, check if the problem is the opening hours or local promotion. Shifting two hours of the schedule from Tuesday to Thursday, where historical demand is higher, often recovers saturation without additional costs.
Low operating margin on a cluster of similar locations: if three locations with the same number of chairs have different margins, the problem is almost always in fixed costs, not revenues. Review rent contracts, utilities, and supplies before raising prices.
Growing DSO: introduce advance payment for treatments above a certain threshold and incentives for immediate balance. A stricter collection policy in a pilot location, measured for 60 days, indicates whether to extend it to others.
A tip: do not change two variables together. If you modify schedule times and prices in the same location in the same month, you will never know which intervention worked. Set a threshold, experiment with a single change, measure the impact after 30 and 60 days.
The method matters more than the single decision: threshold, intervention, measure, repeat. It is slow at first and becomes rapid after the third cycle.
Checklist of Implementation and Data Migration for Multi-site Reporting
Moving from Excel sheets per location to a unified dentistry quality management system requires a precise sequence, not a leap of faith on a Monday morning.
Initial audit: map critical fields, patient demographics, invoices, schedule, inventory, and identify where formats differ between locations.
Sandbox testing: migrate a subset of data into a test environment and verify consistency before touching live data. A consolidated best practice involves validating the schedule and demographics in parallel for at least three months before final synchronization, to limit booking errors during the transition.
Role governance: define who sees what. A location office manager does not necessarily need to see the margin of other locations, while the owner sees everything.
Progressive rollout: activate a pilot location, measure success indicators for two or three weeks, then extend.
Phase | Objective | Risk to Monitor |
|---|---|---|
Data Audit | Map critical fields by location | Inconsistent formats between different management software |
Sandbox | Validate consistency before live launch | Loss of appointments during testing |
Governance | Assign roles and permissions | Access permissions too broad or too restricted |
Rollout | Extend location by location | Staff resistance to the new workflow |
The Part I: Practice Data describes in detail how to structure this phase when migrating to Treatbase.
Why a Data-driven Approach Makes the Difference in Multi-site Practices
Governing a network of practices without a manager who translates KPIs into decisions is like driving with the rearview mirror. A figure is needed, which in Italian practice often coincides with the owner themselves or a senior office manager, to read the report every week and decide on a concrete action, not archive it.
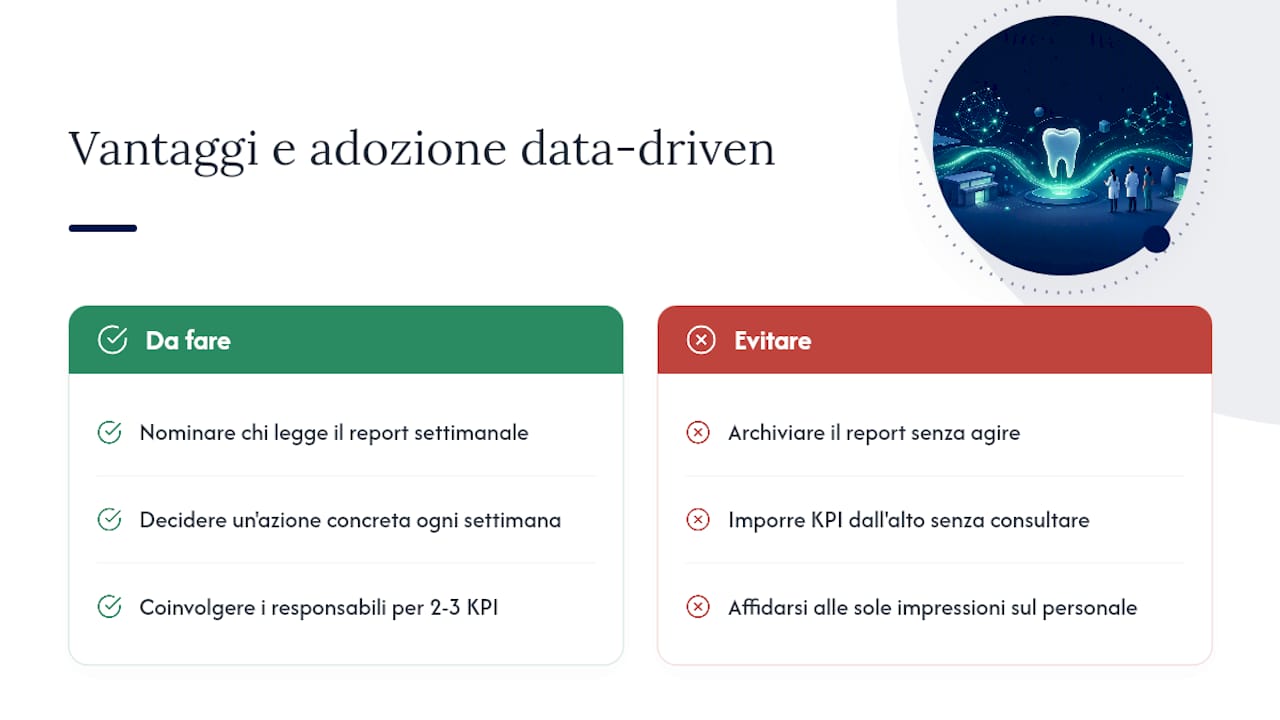
The benefits come in three forms: faster decisions because data is already comparable across locations, optimized staff because actual saturation replaces impressions, and cost control because the margin per location unmasks inefficiencies hidden by overall revenues.
Resistance to change is real and predictable: anyone who has managed a location with a notebook for years will not switch to a dashboard without friction. Involving location managers in choosing the first two or three KPIs to monitor together, rather than imposing them from above, reduces that friction more than any technical training.
— Matteo
h2 id="82">How Treatbase Activates Multi-site Dashboards and Migration Without Stopping the Practice
An advanced management system can build multi-site reports from voice data already recorded during visits, without making staff retype anything. The dashboard aggregates KPIs by location, from chair saturation to operating margin, and automatically compares them with historical data, while reminders and payments remain linked to the same system generating the reports.
The practical difference compared to a shared Excel sheet per location is that here the data arrives already consolidated, updated, and ready to read, not to be rebuilt at the end of each month. The tutorial Part VII: Financial Management and Practice Situation shows how to read margins and cost incidence directly from the dashboard, while Part VI: Payments covers monitoring DSO location by location. For those who also manage the collection cycle independently, specialized services like ClaroClaim offer a useful comparison on revenue cycle management best practices.
Migrating data from another software does not require clinical business interruption. If you manage more than one location and want to see how report consolidation works in practice, request a demo on Treatbase and verify with the team if the structure fits the number of locations you manage.
Sources
Cluster VK21U - Activities of dental practices | Revenue Agency
Demand for dental services in 2023 and outlook for 2024 | Key-Stone
Frequently Asked Questions
What is the best dental management software for multiple locations?
There is no single absolute best management software: the choice depends on the number of locations and the level of clinical data automation. There are systems that stand out for voice data capture and integrated multi-site dashboards without manual transcription.
What are the 2026 updates for dentists regarding VAT?
VAT rules on dental services follow the ordinary regime of healthcare services, with any annual updates defined by the Revenue Agency: for the exact deadline applicable to the practice, it is best to check the updated official circulars, as they vary based on the legal status of the practice.
What is the average income of a dentist in Italy?
There is no single publicly certified figure comparable across all types of practices, as it varies greatly by area, specialization, and number of managed locations. The demand for services remains stable with moderate growth, supporting tendentially positive operating margins for well-managed practices, as indicated by the Key-Stone analysis.
What is the average turnover of a dentist with multiple locations?
Turnover varies too much by size cluster to set a meaningful average figure: the Revenue Agency's VK21U clusters show that the presence of multiple locations shifts the practice into a different category compared to a single-site practice, with margins and fixed costs that are not directly comparable.